Published in August 2023
This report is the fourth in a series of stocktaking of public financial management (PFM) diagnostic tools undertaken by the PEFA Secretariat following the reports from 2004, 2011, and 2018. It is the most ambitious stocktaking to date, building upon the earlier PFM tools stocktaking reports and mapping the tools across additional PFM functions and custodians to examine trends and good practices in tool development and usage.


Summary
Volume 1 presents the updated spectrum of PFM diagnostic tools and their use. It is intended to contribute to increased knowledge of all stakeholders (governments, custodians, development partners, practitioners, and academia) on the available PFM diagnostic tools, as well as good practices related to tool development and use.
Main categories of PFM tools mapped
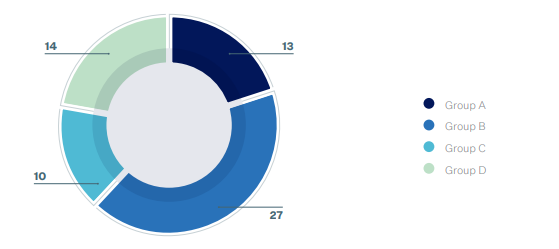
The current mapping identifies 64 PFM diagnostic tools that were available at the end of 2019. The mapped PFM tools are grouped across four groups based on their characteristics. The following table provides a snapshot of the number of tools available in each category at the end of 2019.
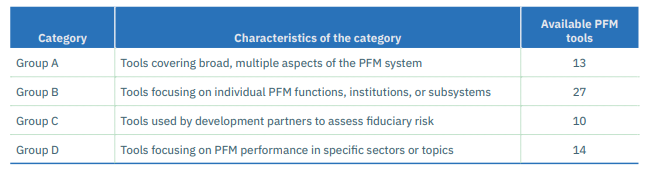
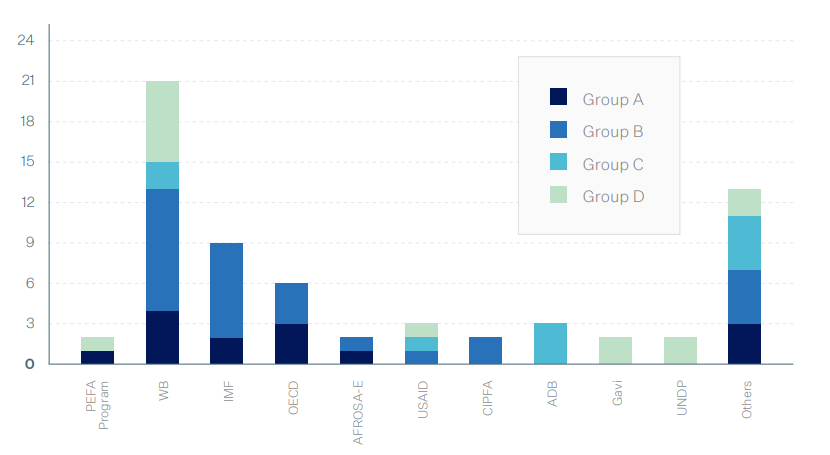
In total, 23 custodians led or coordinated the development of the mapped tools active during the period. Most of the tools across groups are managed by 18 previously mapped custodians that include multilateral and bilateral agencies, international organizations, and regional development banks.
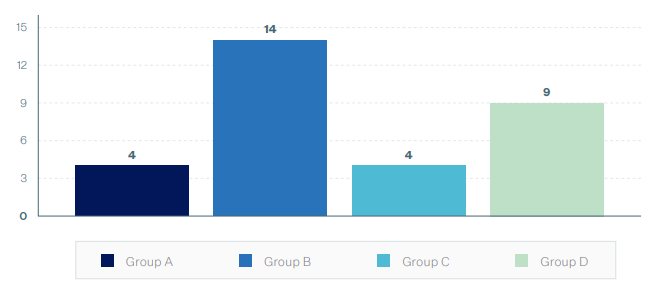
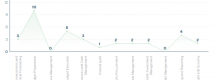
Out of 64 tools in total, the analysis of tool development focuses on 31 tools developed from 2013 to 2019. Among the new 31 PFM diagnostic tools in the four groups in the period 2013–2019 concentration of tool development was in Group B (14 tools or 45 percent) and Group D (9 tools or 29 percent). Together, the tools developed in Group B to assess specific PFM functions and in Group D to assess PFM performance in specific sectors account for almost three quarters of all new tools in the period. Development of tools in Group A to assess broad PFM and in Group C to address fiduciary concerns follows with a much smaller share (with 8 tools developed in both groups, or 26 percent of all tools in total).
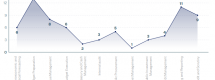
Tools developed by group, 2013-2019
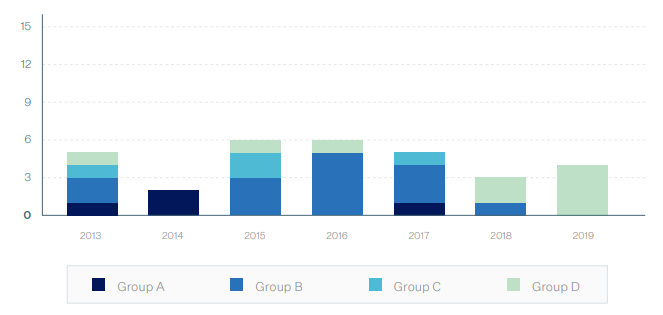
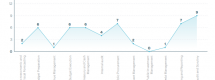
Trends in tool development in the period suggest that tool development in Groups A, B, and C reached its highest point by 2017, with an increase in development of Group D tools from 2018 onwards.
Tools by groups according years, 2013-2019
Technical Coverage
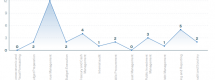
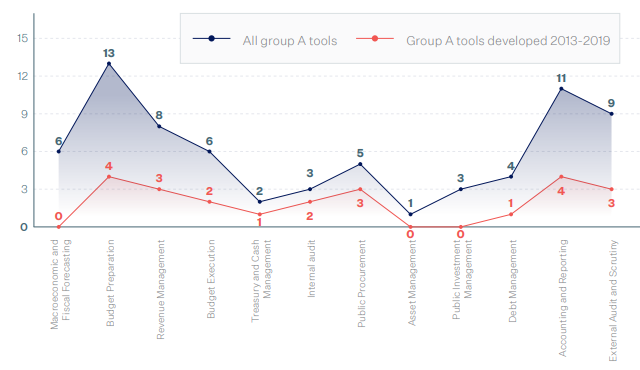
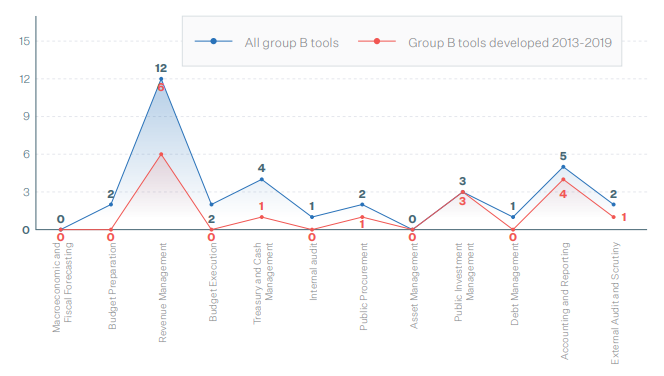
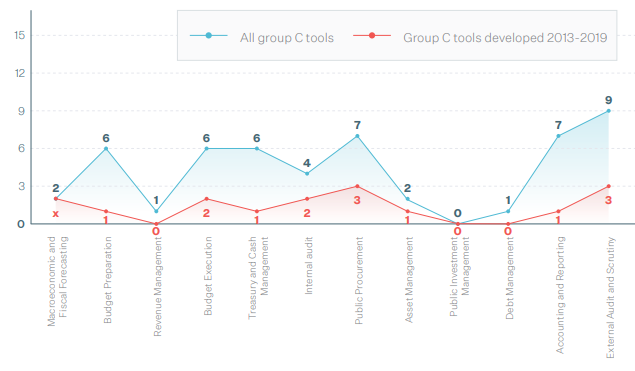
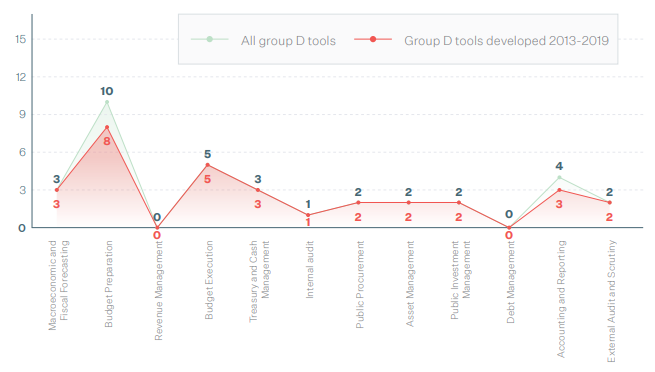
Tools across groups developed in the period 2013–2019 reflect and contribute to a trend of technical coverage focused on assessing countries’ performance in budget preparation (13 tools) and accounting and reporting (12 tools). This is followed by tools covering revenue management, budget execution, public procurement, and external scrutiny (9 tools each). A smaller number of tools developed in the period cover the debt management (1 broad-based tool) and asset management functions (3 tools).
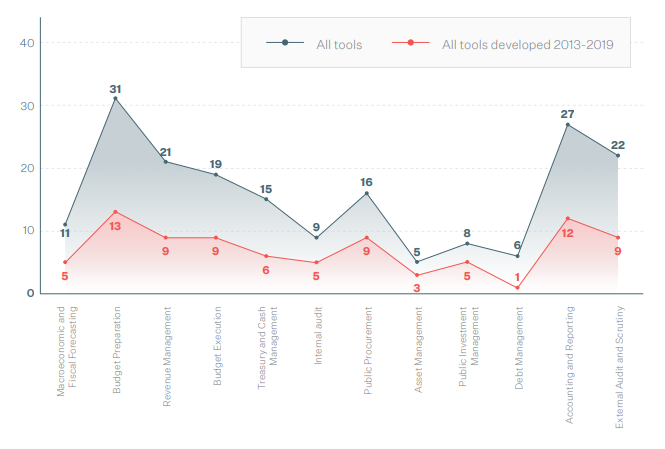
Check the graphs of all tools according categories, compared to those developed in the period 2013-2019: Group A Group B Group C Group D
Trends
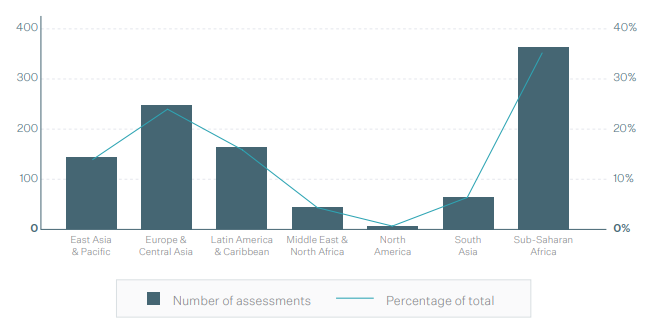
Trends by region
Relative to other regions, the regions using higher number of PFM diagnostic tools are Sub-Saharan Africa and Europe and Central Asia. These regions are followed by Latin America and the Caribbean and East Asia and Pacific, with Middle East and North Africa, South Asia, and North America standing for a lower share of tools used, which in part reflects the number of countries in the region.
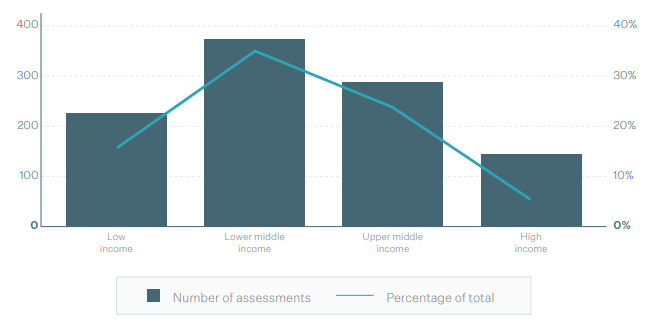
Trends by income
Lower-middle-income countries had a higher uses number of PFM diagnostic tools (36 percent of total uses) followed by the upper-middle-income countries (28 percent of total usage). Low-income countries follow with 22 percent of the total usage. The income level with the least number of PFM tools used is the high-income countries (14 percent of total usage). The highest usage by income level is 14 in low-income, 16 in lower-middle-income, 15 in upper-middle-income, and 7 in high-income countries.
Volume 1 is available in French and Spanish languages:
Inventaire 2022 des Outils de Diagnostic de la Gestion des Finances Publiques : Volume 1 (Français)
Summary
The 2022 PEFA Stocktaking of PFM tools is the fourth stocktaking exercise, following the reports from 2004, 2011 and 2018. This Stocktaking mapped the PFM diagnostic tools available as of end of 2019 (cut-off date). The Volume 2 presents a short overview of tool characteristics and a detailed description of each of the tools mapped. The detailed description of individual PFM tools is organized around four main themes: (i) Objective and features, (ii) Methodology, (iii) Development and use and (iv) Transparency, further elaborated in 17 characteristics.
The tool mapping provides an inventory of PFM diagnostic tools across four groups based on their characteristics.
Click the description of tool characteristics and any individual tool below to learn more. When available in French and Spanish click on FRA and/or ESP.
TOOLS ACCORDING TO GROUPS

DESCRIPTION OF TOOL CHARACTERISTICS
Objective and features
1. Objective
2. Institutional coverage
3. Technical coverage
4. Application method
Methodology
5. Methodology
6. Benchmarking and scoring system.
7. Linkage to PEFA framework
8. Complementarity with PEFA framework
Development and use
9. Development and coordination
10. Assessment management
11. Uses by government and members of the PFM community
12. Sequencing with other tools
13. PFM capacity building
14. Tracking of changes and frequency of assessments
15. Resource requirements
Transparency
16. Access to methodology
17. Access to assessment results
GROUP A TOOLS: BROAD BASED PMF DIAGNOSTIC TOOLS
A01 – PEFA Framework (PEFA) - PEFA Secretariat FRA ESP
A02 – Fiscal Transparency Evaluation (FTE) - IMF
A03 – Senior Budget Official Reviews of Budgeting Systems - OECD
A04 – International Budget Practices & Procedures Database (IBPPD) - OECD
A05 – SIGMA Principles of Public Administration (PPA) - OECD
A06 – Open Budget Survey (OBS) - IBP FRA ESP
A07 – Public Expenditure Review (PER) - WB
A08 – Rapid Assessments and Action Plans to Improve Delivery in SNGs (RAAP-ID) - WB
A09 – MiGestion Institutional Capacity Diagnostic - WB
A10 – Benchmarking Fiscal Decentralization (BFD) - COE
A11 – Country Policy and Institutional Assessment (CPIA) - WB
A12 – Country Policy and Institutional Assessment (CPIA) - AfDB FRA
A13 – Public Financial Management Reporting Framework (PFMRF) - AFROSAI-E
GROUP B TOOLS: PFM-FUNCTION SPECIFIC TOOLS
B01 – Public Expenditure Tracking Surveys (PETS) - WB
B02 – Tax Administration Diagnostic Assessment Tool (TADAT) - IMF (TADAT Secretariat) FRA ESP
B03 – Tax Policy Assessment Framework (TPAF) - IMF
B04 – Revenue Administration Gap Analysis Program (RA-GAP) - IMF
B05 – Revenue Administration Fiscal Information Toolkit (RA-FIT) - IMF FRA ESP
B06 – Tax Administration Series on OECD and other Advanced and Emerging Economies (TAS) - OECD FRA
B07 – Development of Implementation and Monitoring Directives for Tax Reform (Tax Diamond) - WB
B08 – Extractive Industries Transparency Initiative (EITI) - EITI FRA ESP
B09 – Collecting Taxes Database (CTD) - USAID
B10 – African Tax Outlook (ATO) - ATAF
B11 – Tax Administration Maturity Model Series - OECD
B12 – Public Investment Management Assessment (PIMA) - IMF
B13 – Diagnostic Framework for Assessing Public Investment Management (DF-PIM) - WB

GROUP B TOOLS: PFM-FUNCTION SPECIFIC TOOLS (continued)
B14 – PPP Fiscal Risk Assessment Model (PFRAM) - IMF
B15 – Public Sector Balance Sheet (PSBS) - IMF
B16 – Debt Management Performance Assessment (DeMPA) - WB FRA ESP
B17 – Methodology for Assessing Procurement Systems (MAPS) - OECD (MAPS Secretariat) FRA ESP
B18 – e-Procurement Toolkit - WB
B20 – Treasury Diagnostic Toolkit (TDT) - WB
B21 – Treasury Single Account (TSA) Rapid Assessment Toolkit - WB FRA ESP
B22 – Report on the Enhancement of Public Sector Financial Reporting Toolkit (REPF) - WB
B23 – International Public Sector Financial Accountability Index - IFAC - CIPFA
B24 – Financial Management Model (FMM) - CIPFA
B25 – Internal Audit Capability Model (IA-CM) - IIA
B26 – Supreme Audit Institutions Performance Measurement Framework (SAI PMF) - INTOSAI FRA ESP
B27 – Institutional Capacity Building Framework (ICBF) - AFROSAI-E
GROUP C TOOLS: FIDUCIARY TOOLS
C01 – Financial Management Assessment (FMA) - ADB
C02 – Tool for Determining the Level of Development and Use of PFM Systems (GUS) - IADB
C03 – Assessment of Financial Management Systems in Bank-Financed Investment Operations - WB
C04 – Fiduciary Risk Assessment (FRA) - FCDO
C05 – Guidelines for Risk Management (GRM) - DANIDA
C06 – PFM Risk Assessment Framework (PFMRAF) - USAID
C07 – Governance Risk Assessment in ADB operations (GRA) - ADB
C08 – Country and Sector Procurement Risk Assessment (CSPRA) - ADB
C09 – Program-for-Results Fiduciary System Assessment (FSA) - WB
GROUP D TOOLS: SECTOR-SPECIFIC PFM TOOLS
D01 – FinHealth: PFM in Health Toolkit - WB
D02 – Health Financing Progress Matrix (HFPM) - WHO FRA
D04 – Programme Capacity Assessment (PCA) - Gavi
D05 – Financial Sustainability Diagnostic Tool (FSDT) - Gavi
D06 – Climate Public Expenditure and Institutional Review (CPEIR) - UNDP
D07 – Climate Change Budget Integration Index (CCBII) - UNDP
D08 – Disaster Response: A Public Financial Management Review Toolkit (PD-PFM) - WB
D09 – Gender Responsive Public Financial Management Framework (GRPFM) - PEFA Secretariat FRA ESP
D10 – Equity Budgeting Tool (EBT) - GIZ
D11 – Integrated State-Owned Enterprises Framework (iSOEF) - WB
D12 – Corporate Governance: Report on Observance of Standards and Codes (CG-ROSC) - WB
D13 – Corporate Governance SOE Progression Matrix - WBG (IFC)
D14 – Accounting and Auditing: Report on Observance of Standards and Codes (AA-ROSC) - WB


