Background
Section 1

What Is PEFA?

This section introduces the Public Expenditure and Financial Accountability (PEFA) program and methodology. It describes what PEFA partnership is, how PEFA measures public financial management (PFM) performance, as well as the advantages and limitations of the PEFA data.

The PEFA Partnership Program

PEFA is a partnership program of the European Commission, the International Monetary Fund (IMF), the World Bank, and the governments of France, Luxembourg, Norway, the Slovak Republic, Switzerland, and the United Kingdom. The partnership was set up to establish a uniform approach to collecting information on countries’ public financial management performance.

The PEFA framework identifies 94 characteristics (known as dimensions) within 31 key components of PFM (known as indicators) in seven broad areas of PFM (known as pillars).

Learn More

The PEFA Framework

The PEFA program provides a framework for assessing and reporting on the strengths and weaknesses of PFM using a letter-grade scoring system to measure performance. PEFA is designed to provide a snapshot of PFM performance at a specific point in time. The methodology can be replicated in successive assessments to document changes in performance over time.

"The PEFA program provides a framework for assessing and reporting on the strengths and weaknesses of PFM."

PFM in instrumental in the achievement of broader development objectives: macroeconomic stability, efficient resource allocation, and service delivery. Good PFM is “the linchpin that ties together available resources, delivery of services, and achievement of government policy objectives. If it is done well, PFM ensures that revenue is collected efficiently and used appropriately and sustainably” (PEFA Secretariat 2016).

PEFA Explainer Video

The PEFA framework identifies 94 characteristics (known as dimensions) within 31 key components of PFM (known as indicators) in seven broad areas of PFM (known as pillars).

PEFA 2016 Framework

The updated PEFA framework was launched in 2016 (often titled PEFA 2016) and is based on the stages of the annual budget cycle. It recognizes that a good PFM system is instrumental in supporting the objectives of aggregate fiscal discipline, strategic allocation of resources, and efficient delivery of services. The framework can be applied at both national and subnational levels.

"The updated PEFA framework is based on the stages of the annual budget cycle."

The figure illustrates the PFM system as outlined in the PEFA 2016 framework. It includes seven pillars corresponding to the phases of the budget cycle—policy-based fiscal strategy and budgeting, predictability and control in budget execution, accounting and reporting, and external scrutiny and audit. It also includes two cross-cutting pillars on the transparency of public finances and the management of assets and liabilities and a pillar on budget reliability that represents an output of the budget process.

The PFM system according to the 2016 PEFA framework

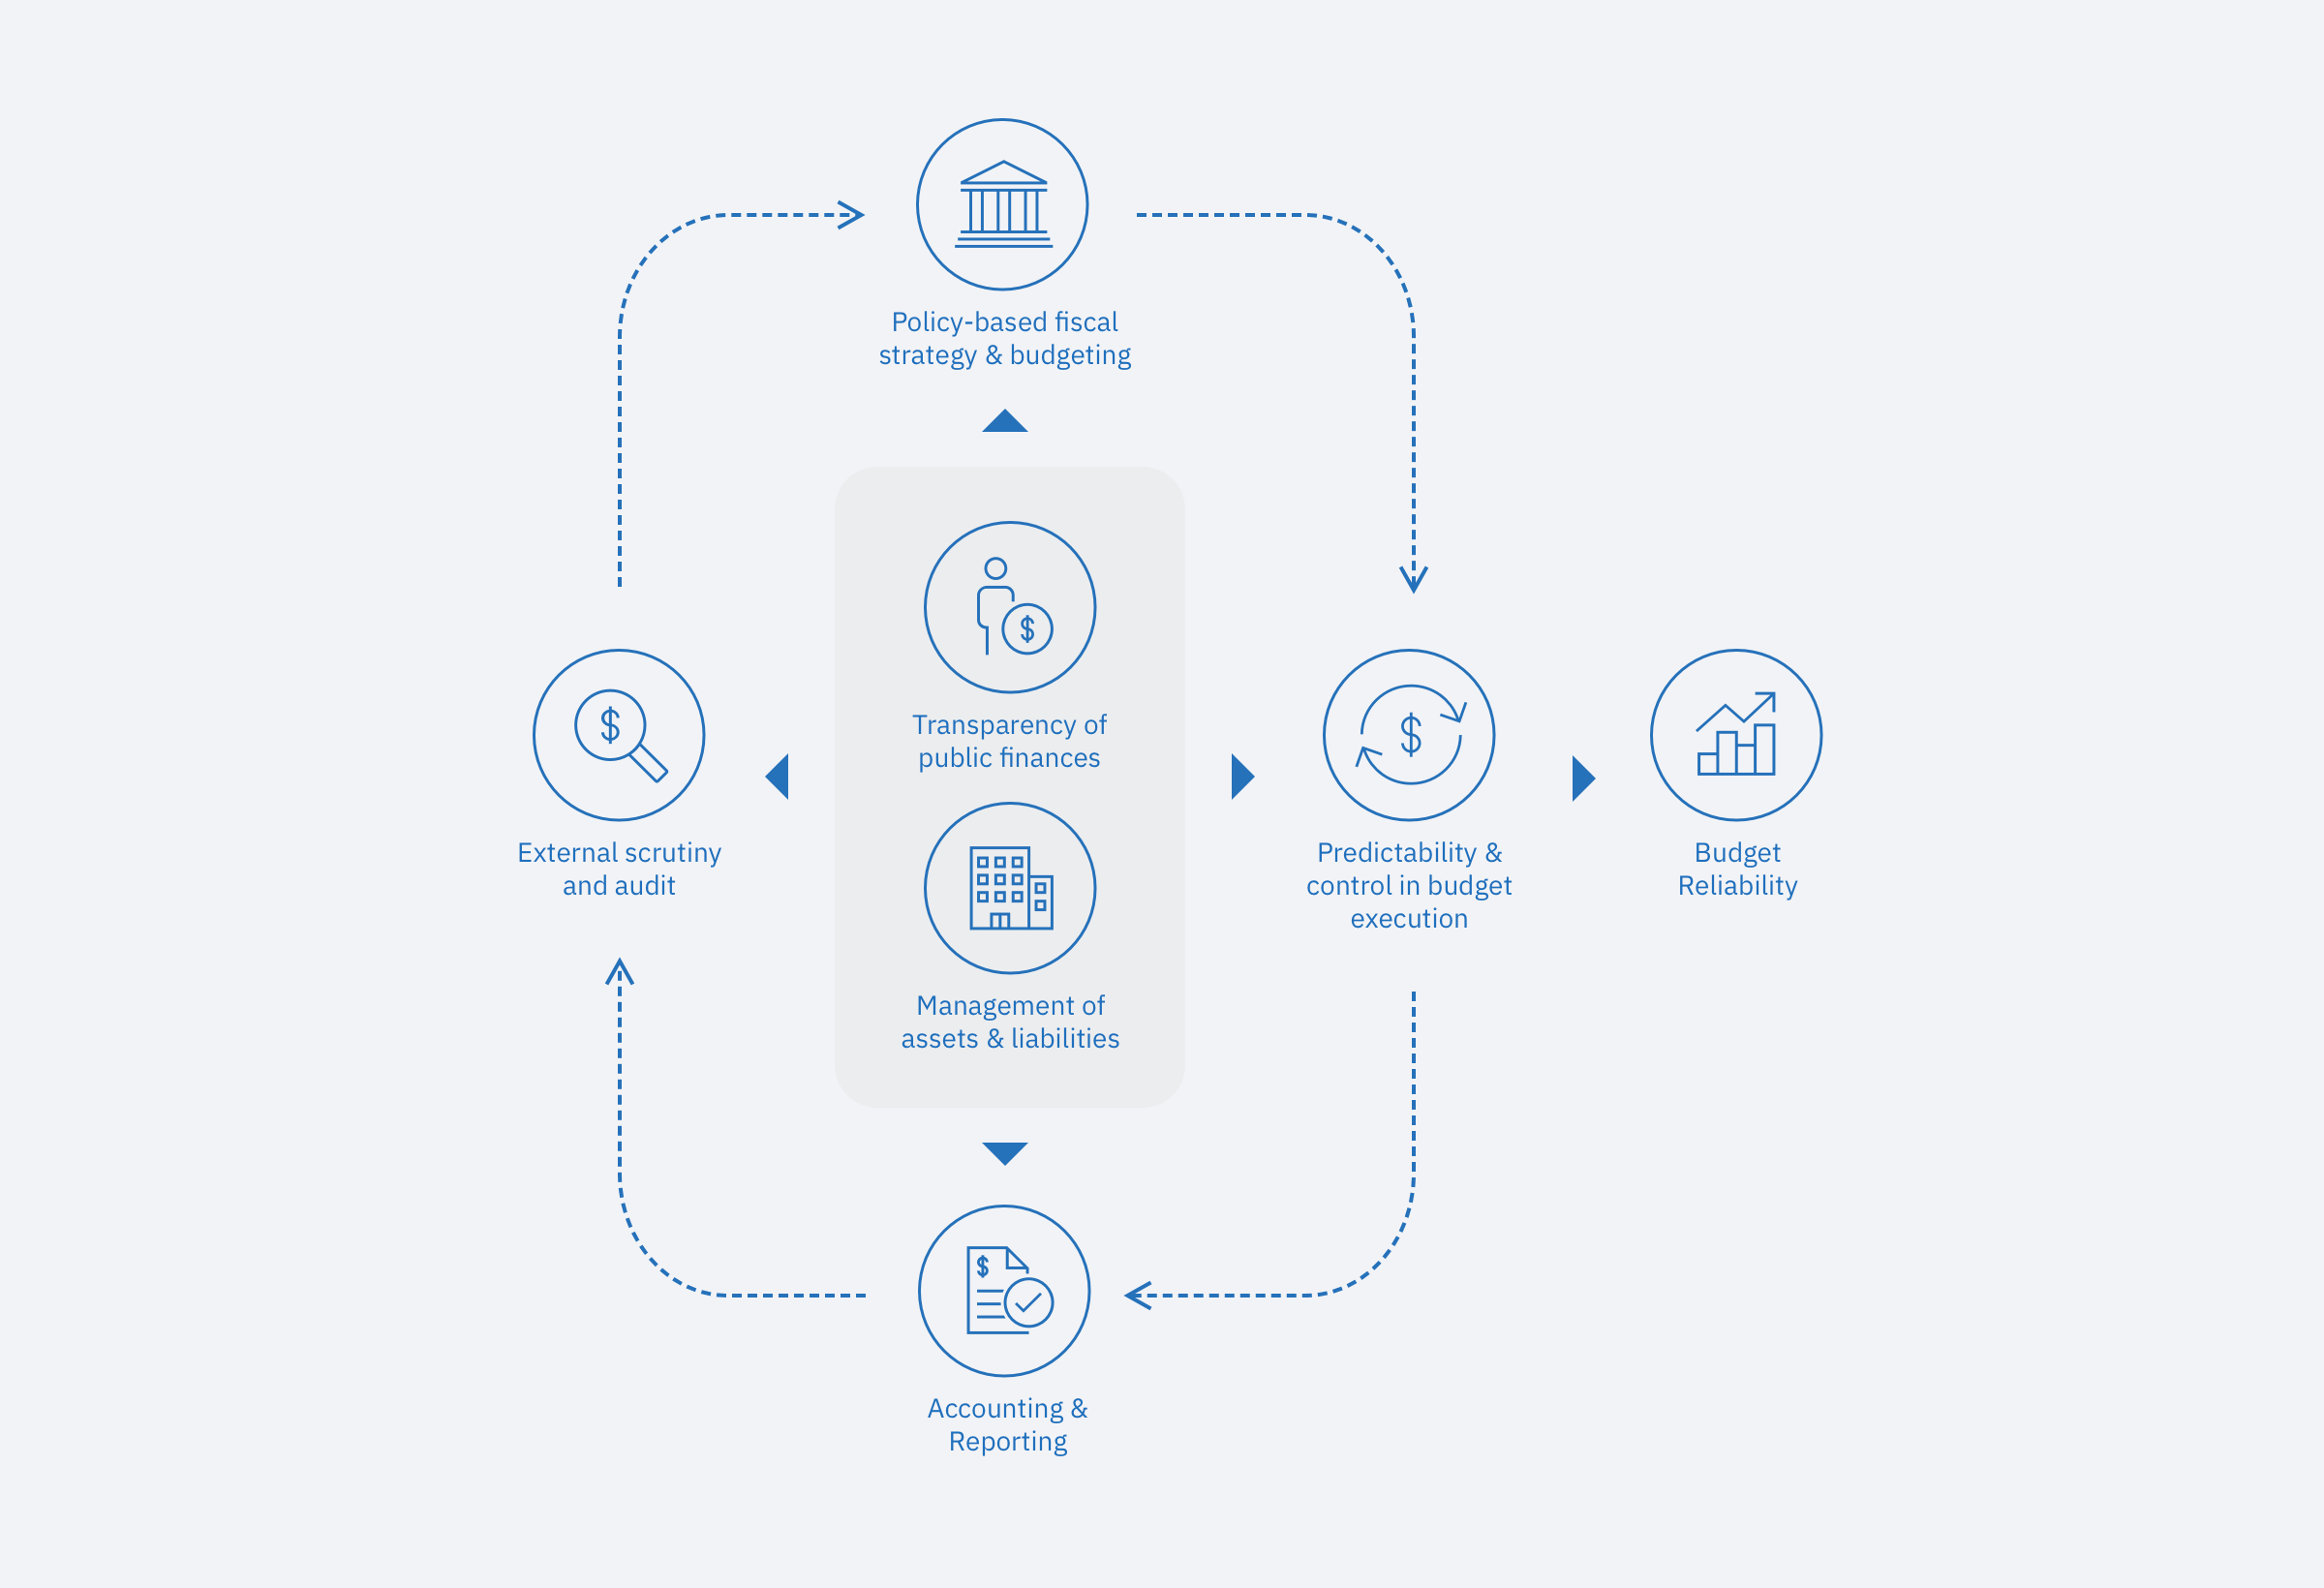
Source: PEFA Secretariat 2016. Note: PFM = public financial management. PEFA = public expenditure and financial accountability.

Pillars

Budget reliability
The government budget is realistic and is implemented as intended. This is measured by comparing actual revenues and expenditures (the immediate results of the PFM system) with the original approved budget.
Transparency of public finances
Information on PFM is comprehensive, consistent, and accessible to users. This is achieved through comprehensive budget classification, transparency of all government revenue and expenditure including intergovernmental transfers, published information on performance in service delivery, and ready access to fiscal and budget documentation.
Management of assets and liabilities
Effective management of assets and liabilities ensures that public investments provide value for money, assets are recorded and managed, fiscal risks are identified, and debts and guarantees are prudently planned, approved, and monitored.
Policy-based fiscal strategy and budgeting
The fiscal strategy and budget are prepared with due regard to government fiscal policies, strategic plans, and adequate macroeconomic and fiscal projections.
Predictability and control in budget execution
The budget is implemented within a system of effective standards, processes, and internal controls, ensuring that resources are obtained and used as intended.
Accounting and reporting
Accurate and reliable records are maintained, and information is produced and disseminated at appropriate times to meet decision-making, management, and reporting needs.
External scrutiny and audit
Public finances are independently reviewed, and there is external follow-up on the implementation of recommendations for improvement by the executive.
Budget reliability
The government budget is realistic and is implemented as intended. This is measured by comparing actual revenues and expenditures (the immediate results of the PFM system) with the original approved budget.

Framework 2016 Stats

pillars
7
indicators
31
dimensions
94

The table below presents the 7 pillars, 31 indicators, and 94 dimensions of the PEFA framework.

More information on the PEFA 2016 methodology is available on the FAQ section of the PEFA website or in the 10 Things about PEFA 2016 leaflet.

The 2016 PEFA framework indicators

PILLARS
INDICATORS
DIMENSIONS
I. Budget reliability
1
Aggregate expenditure outturn
1.1
Aggregate expenditure outturn
2
Expenditure composition outturn
2.1
Expenditure composition outturn by function
2.2
Expenditure composition outturn by economic type
2.3
Expenditure from contingency reserves
3
Revenue outturn
3.1
Aggregate revenue outturn
3.2
Revenue composition outturn
II. Transparency of public finances
4
Budget classification
4.1
Budget classification
5
Budget documentation
5.1
Budget documentation
6
Central government operations outside financial reports
6.1
Expenditure outside financial reports
6.2
Revenue outside financial reports
6.3
Financial reports of extrabudgetary units
7
Transfers to subnational governments
7.1
System for allocating transfers
7.2
Timeliness of information on transfers
8
Performance information for service delivery
8.1
Performance plans for service delivery
8.2
Performance achieved for service delivery
8.3
Resources received by service delivery units
8.4
Performance evaluation for service delivery
9
Public access to fiscal information
9.1
Public access to fiscal information
III. Management of assets and liabilities
10
Fiscal risk reporting
10.1
Monitoring of public corporations
10.2
Monitoring of subnational governments
10.3
Contingent liabilities and other fiscal risks
11
Public investment management
11.1
Economic analysis of investment proposals
11.2
Investment project selection
11.3
Investment project costing
11.4
Investment project monitoring
12
Public asset management
12.1
Financial asset monitoring
12.2
Nonfinancial asset monitoring
12.3
Transparency of asset disposal
13
Debt management
13.1
Recording and reporting of debt and guarantees
13.2
Approval of debt and guarantees
13.3
Debt management strategy
IV. Policy-based fiscal strategy and budgeting
14
Macroeconomic and fiscal forecasting
14.1
Macroeconomic forecasts
14.2
Fiscal forecasts
14.3
Macrofiscal sensitivity analysis
15
Fiscal strategy
15.1
Fiscal impact of policy proposals
15.2
Fiscal strategy adoption
16
Medium-term perspective in expenditure budgeting
16.1
Medium-term expenditure estimates
16.2
Medium-term expenditure ceilings
16.3
Alignment of strategic plans and medium-term budgets
16.4
Consistency of budgets with previous yearÍs estimates
17
Budget preparation process
17.1
Budget calendar
17.2
Guidance on budget preparation
17.3
Budget submission to the legislature
18
Legislative scrutiny of budgets
18.1
Scope of budget scrutiny
18.2
Legislative procedures for budget scrutiny
18.3
Timing of budget approval
18.4
Rules for budget adjustment by the executive
V. Predictability and control in budget execution
19
Revenue administration
19.1
Rights and obligations for revenue measures
19.2
Revenue risk management
19.3
Revenue audit and investigation
19.4
Revenue arrears monitoring
20
Accounting for revenue
20.1
Information on revenue collections
20.2
Transfer of revenue collections
20.3
Revenue accounts reconciliation
21
Predictability of in-year resource allocation
21.1
Consolidation of cash balances
21.2
Cash forecasting and monitoring
21.3
Information on commitment ceilings
21.4
Significance of in-year budget adjustments
22
Expenditure arrears
22.1
Stock of expenditure arrears
22.2
Expenditure arrears monitoring
23
Payroll controls
23.1
Integration of payroll and personnel records
23.2
Management of payroll changes
23.3
Internal control of payroll
23.4
Payroll audit
24
Procurement
24.1
Procurement monitoring
24.2
Procurement methods
24.3
Public access to procurement information
24.4
Procurement complaints management
25
Internal controls on nonsalary expenditure
25.1
Segregation of duties
25.2
Effectiveness of expenditure commitment controls
25.3
Compliance with payment rules and procedures
26
Internal audit
26.1
Coverage of internal audit
26.2
Nature of audits and standards applied
26.3
Implementation of internal audits and reporting
26.4
Response to internal audits
VI. Accounting and auditing
27
Financial data integrity
27.1
Bank account reconciliation
27.2
Suspense accounts
27.3
Advance accounts
27.4
Financial data integrity processes
28
In-year budget reports
28.1
Coverage and comparability of reports
28.2
Timing of in-year budget reports
28.3
Accuracy of in-year budget reports
29
Annual financial reports
29.1
Completeness of annual financial reports
29.2
Submission of reports for external audit
29.3
Accounting standards
VII. External scrutiny and audit
30
External audit
30.1
Audit coverage and standards
30.2
Submission of audit reports to the legislature
30.3
External audit follow-up
30.4
Supreme Audit Institution independence
31
Legislative scrutiny of audit reports
31.1
Timing of audit report scrutiny
31.2
Hearings on audit findings
31.3
Recommendations on audit by the legislature
31.4
Transparency of legislative scrutiny of audit reports

Want to know more about the previous 2011 version of the framework and its indicators set?

Learn More

Previous Versions of the PEFA Methodology

The PEFA methodology has evolved over time. First released in 2005, updated frameworks followed in 2011 and 2016. Unlike the 2016 framework, the 2011 framework did not represent a significant departure from the 2005 framework, as only three indicators were revised (PI–2, PI–3, and PI–19).

Using PEFA to Measure Changes in Performance over Time

The 2016 framework represents a significant revision from previous versions. While some indicators remain directly comparable, other indicators have been revised, dropped, or added, rendering them less comparable or, in some cases, incomparable.

The transition to the 2016 framework has been managed by the continued use of the 2011 framework in an accompanying annex. This dual assessment approach generated one more wave of comparable assessments within the data set, creating a larger sample of comparable indicators with which to observe changes in PFM performance over time.

A high-level overview of how PEFA indicators and dimensions of 2016 and 2011 methodologies are connected and a more thorough analysis of similarities and differences between the two frameworks are available at the resources section of the PEFA website.

How PEFA Measures PFM Performance?

Each dimension measures performance against a four-point ordinal scale from D to A that captures levels of compliance with good practices in PFM. D is the lowest score; A is the highest score.

Scoring the PEFA indicators

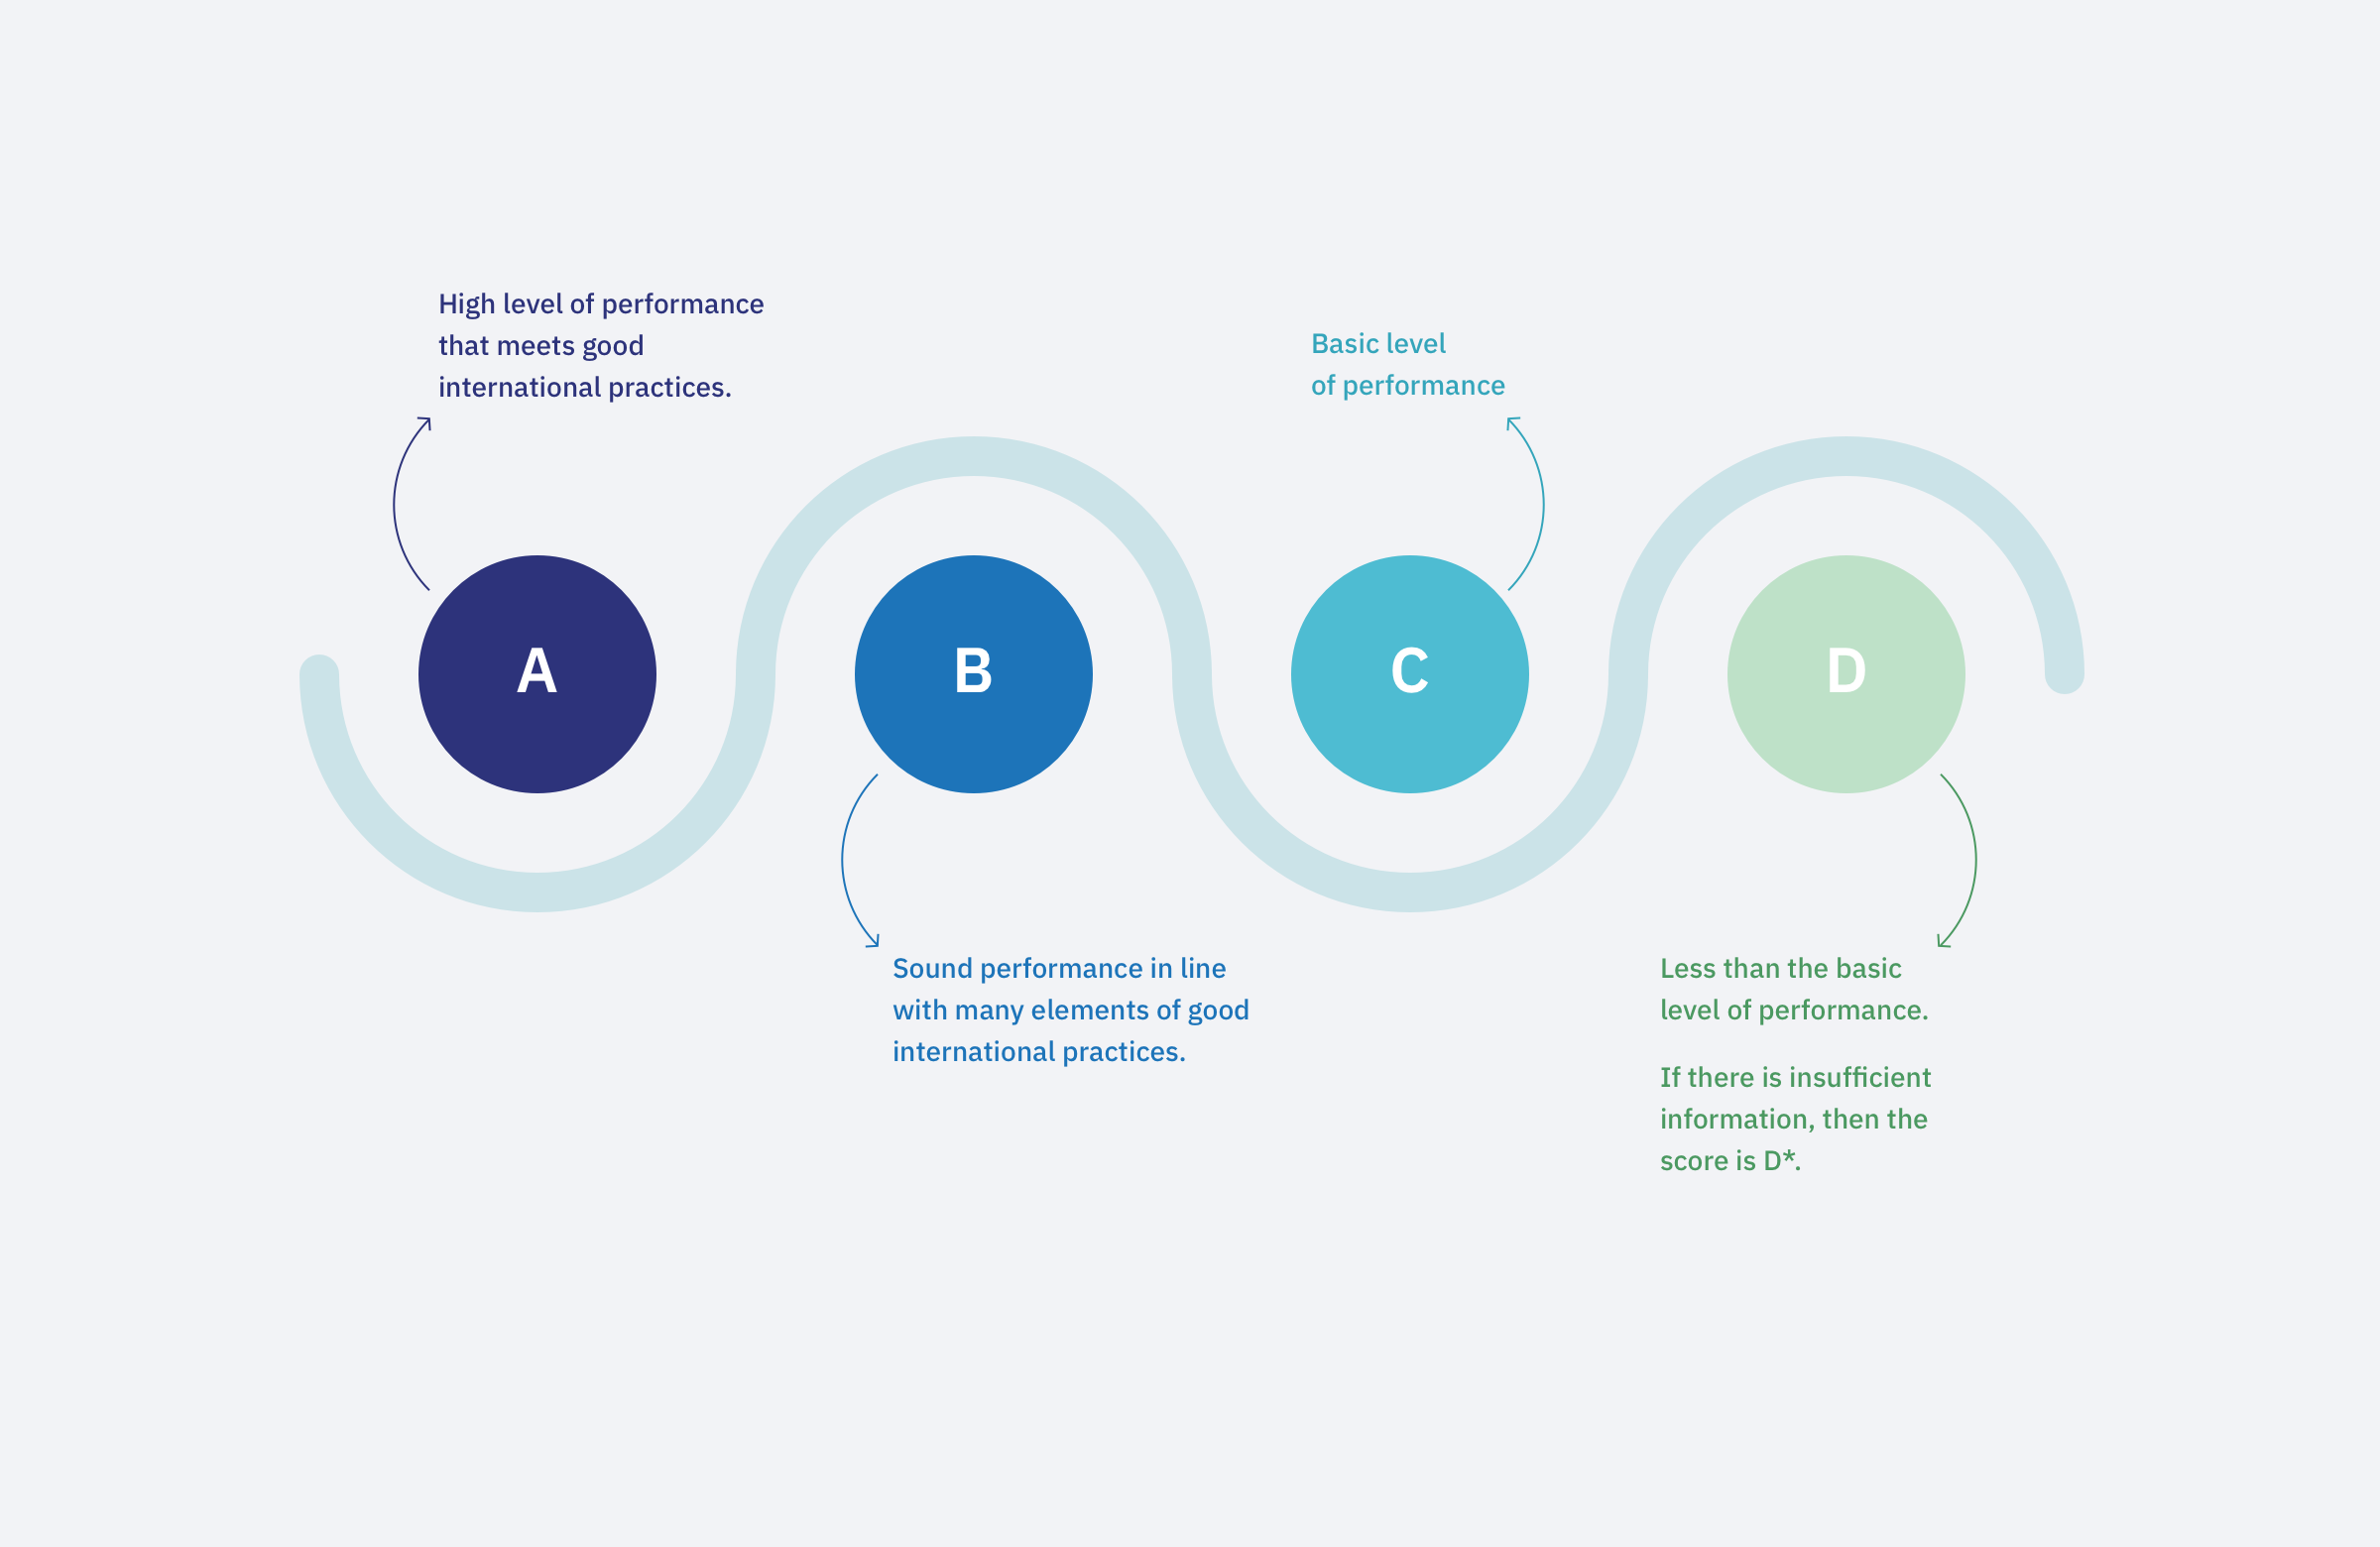
Note: PEFA = public expenditure and financial accountability.

Methods

To calculate the indicator score, the assessor must combine the dimension scores using one of two methods referred to as method 1 (M1) and method 2 (M2). The scoring method is clearly prescribed for each of the indicators.

Objectives

M1 Method
The M1 method is applied for multidimensional indicators where poor performance on one dimension of the indicator is likely to undermine the impact of good performance on other dimension(s) of the same indicator. Under this method, the indicator is assigned the score of the lowest dimension, but a “+” is added if one of the other dimension scores is higher.
M2 Method
The M2 method is applied for multidimensional indicators where a low score on one dimension of the indicator does not necessarily undermine the impact of higher scores on other dimensions of the same indicator. Because it applies equal weighting to each of the dimension scores within the indicator, the M2 method is also referred to as the “averaging method.”
M1 Method
The M1 method is applied for multidimensional indicators where poor performance on one dimension of the indicator is likely to undermine the impact of good performance on other dimension(s) of the same indicator. Under this method, the indicator is assigned the score of the lowest dimension, but a “+” is added if one of the other dimension scores is higher.

Performance indicators with only one dimension simply take the score of this dimension and are not eligible for a “+“ rating.

A score rated as NA (not applicable) is used when a dimension or indicator is not applicable to country circumstances (for example, the assessment of fiscal risks stemming from subnational governments is not applicable for small countries with no subnational governments). In the 2016 framework a score rated as D* replaced a score of NR in the previous version of the framework for cases where information to score a dimension is lacking (lack of information is not considered good practice).

Advantages and Limitations of PEFA

The PEFA framework emerged in 2005 as the instrument that harmonized various PFM diagnostic tools used by development partners. As a result, it has become the most widely used assessment of PFM performance.

Advantages

Comprehensiveness
It is the most comprehensive measure of PFM to date, covering the entire budget cycle as well as other key PFM areas.
Global coverage
PEFA has wide global coverage. Since its launch in 2005, there have been more than 600 assessments at both national and subnational levels in 151 countries and territories.
Comparison over time
The methodology is standardized so that it can be repeated and changes can be tracked over time.
Combination of quantitative and qualitative assessment
The framework includes a narrative report that discusses qualitative aspects of PFM performance to complement the quantitative scores.
Quality assurance
The PEFA Secretariat provides quality assurance to ensure that the standards of assessment are met consistently across countries and time.
Comprehensiveness
It is the most comprehensive measure of PFM to date, covering the entire budget cycle as well as other key PFM areas.

Limitations

Geographic bias
The PEFA data set is biased toward poorer regions and smaller countries, which are overrepresented compared with higher-income regions and larger countries.
Snapshot of performance
The PEFA framework only provides a snapshot of PFM performance; more specialized tools are often needed to provide in-depth analysis, such as, for example, the IMF’s Public Investment Management Assessments (PIMAs) and Fiscal Transparency Evaluations (FTEs), the World Bank’s Debt Management Performance Assessment (DeMPA), and others. There is also considerable debate in the PFM community about whether PEFA performance indicators accurately measure PFM performance and whether these performance indicators matter for fiscal policy, service delivery, and other important government functions.
Time inconsistencies
While one of the biggest advantages of PEFA is that it allows changes in scores to be monitored over time, PEFA assessments typically are carried out every three to five years. The timing of successive assessments varies widely across countries. Therefore, there is no consistent timing of the data collected.
Comparison over time
The PEFA framework has changed over time, with the most significant changes occurring between the 2011 and 2016 frameworks. PEFA 2016 provides a more robust assessment of PFM performance and covers new areas of performance that were not included in the previous versions. These areas include macrofiscal forecasts, a medium-term fiscal strategy and outlook, a medium-term perspective in expenditure budgeting, and public assets and investment management. Thus, comparisons over time are not possible for the new and revised performance indicators.
Publicly available data
Not all PEFA assessments are publicly available. Only about two-thirds of PEFA assessments have been made publicly available through the PEFA Secretariat website. In some cases, the failure to publish is simply due to delays, while in other cases, the government has chosen not to publish the report.
Isomorphic mimicry
According to Andrews (2009, 2011), it is easier to improve on some performance indicators than others by changing the form of the PFM system rather than how it functions, which he describes as isomorphic mimicry. He notes that de jure (normative practices such as the adoption of public finance law), upstream (initial phases of the budget cycle that center largely around policy-based fiscal strategy and budgeting), and concentrated (the involvement of a smaller group of stakeholders in PFM reforms) functions of the PFM system are more amenable to isomorphic mimicry than de facto, downstream, and deconcentrated functions. Thus, an improvement in a de jure performance indicator may have little or no tangible impact in practice.
End in themselves
Despite guidance from the PEFA Secretariat, many countries and donors treat improvements in performance ratings as an end in themselves. PEFA scores should be considered as one input of many in any PFM reform process.
Geographic bias
The PEFA data set is biased toward poorer regions and smaller countries, which are overrepresented compared with higher-income regions and larger countries.

References

Andrews, M. 2009. “Isomorphism and the Limits to African Public Financial Management Reform.” HKS Faculty Research Working Paper RWP09-012, John F. Kennedy School of Government, Harvard University, Cambridge, MA. https://dash.harvard.edu/handle/1/4415942.

Andrews, M. 2011. “Which Organizational Attributes Are Amenable to External Reform? An Empirical Study of African Public Financial Management.” International Public Management Journal 14 (2): 131–56. doi: 10.1080/10967494.2011.588588. https://www.tandfonline.com/doi/abs/10.1080/10967494.2011.588588

PEFA (Public Expenditure and Financial Acountability) Secretariat. 2016. PEFA 2016 Framework. Washington, DC: PEFA Secretariat. http://pefa.org/resources/pefa-2016-framework.