
Global Trends in Public Financial Management Performance
This section presents key trends in public financial management (PFM) performance as measured by the Public Expenditure and Financial Accountability (PEFA) assessment framework across different regions, country income levels, time periods, and the seven key pillars of PFM. Both the 2011 and the 2016 PEFA frameworks are used to highlight key trends. A more in-depth analysis of the 2016 framework assessments is presented for the first time to identify trends across the seven key pillars of PFM.
Key Messages
- Governments perform strongest on budget preparation and weakest on the effectiveness of internal audit and external audit and scrutiny.
- At the subnational level, governments had the strongest performance in accounting and reporting.
- Only two-thirds of documents that governments submit to the legislature for review are also publicly available to citizens.
Global Trends
Since the launch of the PEFA framework in 2005, 549 PEFA assessments had been completed as of December 31, 2019. The PEFA framework has been applied at both the national and subnational levels, with 60 percent of assessments at the national level and 40 percent at the subnational level.
Map of PEFA assessments, 2005–19
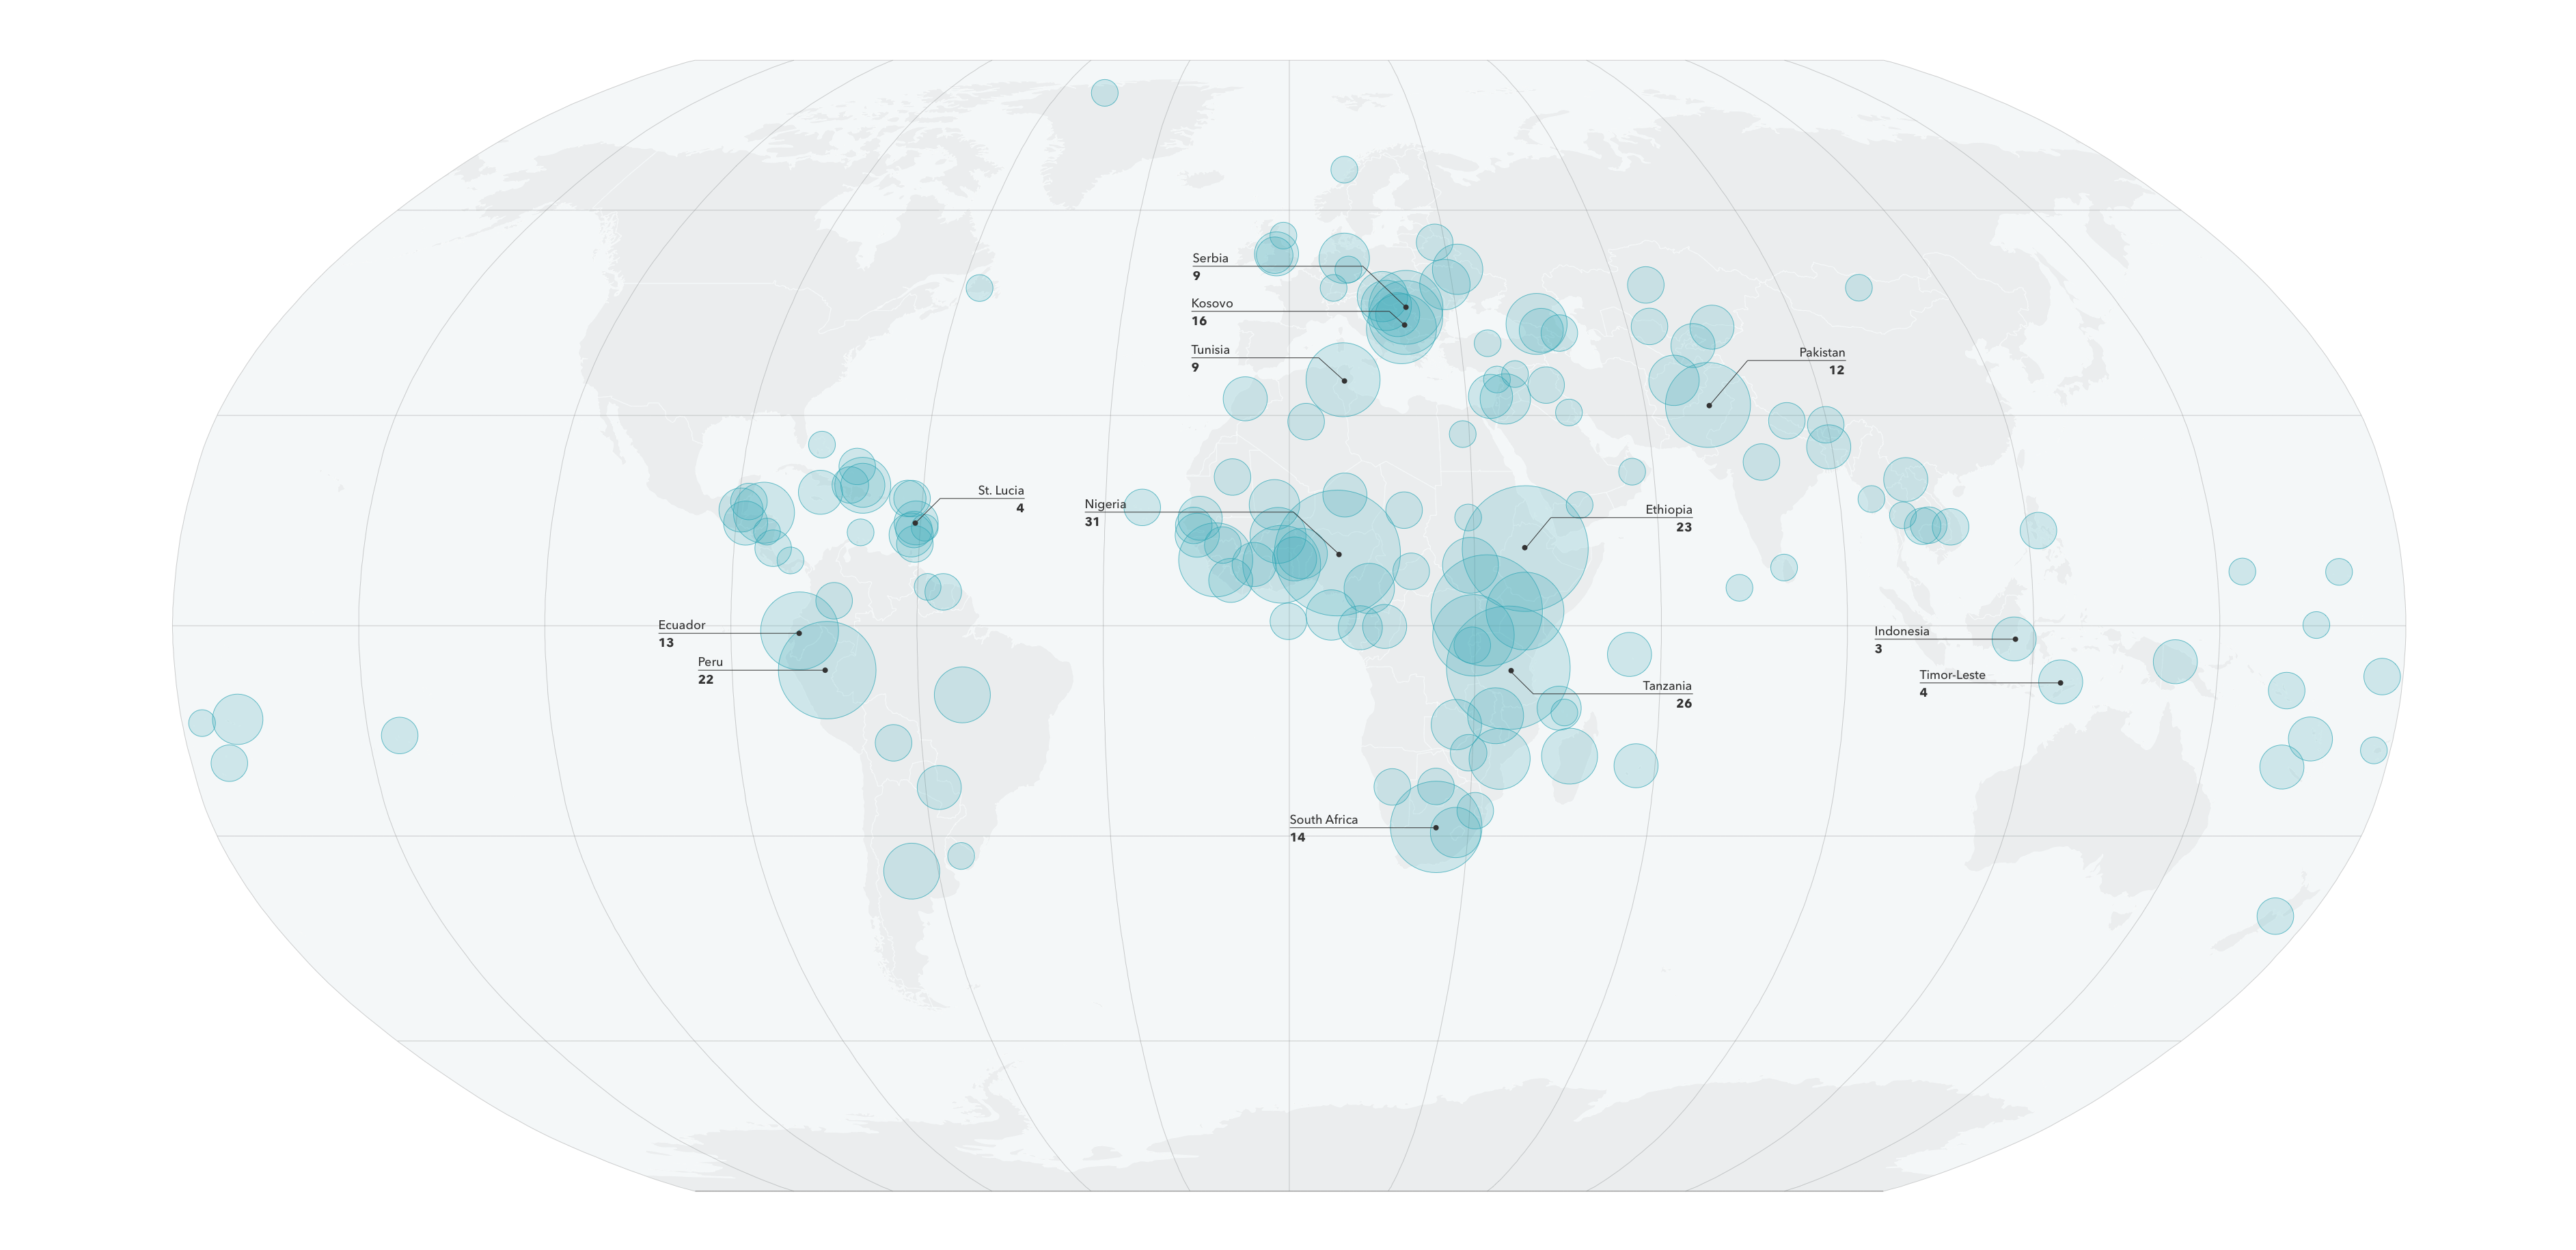
PEFA assessments have been carried out in 151 countries around the world.
Most PEFA assessments have been implemented in lower-middle-income countries, followed by low-income and upper-middle-income countries. Only 36 assessments or 6.6 percent of all PEFA assessments have been carried out in high-income countries. However, this trend is changing, and several assessments are in the pipeline in high-income countries, especially at the subnational level.
The Sub-Saharan Africa region has had the most PEFA assessments, followed by Latin America and the Caribbean and Europe and Central Asia.
More than 20 bilateral and multilateral development organizations have led PEFA assessments, principally the World Bank and the European Union, followed by the Swiss State Secretariat for Economic Affairs and the International Monetary Fund. A growing number of governments are taking ownership of the assessment process and are writing the reports themselves or partnering with a development organization to carry out the assessment.
The PEFA assessment framework was launched in 2005 and subsequently revised in 2011 and 2016. Unlike the 2016 framework, the 2011 framework did not represent a significant departure from the 2005 framework because only three indicators were revised (PI–2, PI–3, and PI–19). Therefore, all assessments using the 2005 and 2011 frameworks are identified as “PEFA 2011.” Between 2005 and 2019, an average of 27 PEFA assessments were completed each year.
1 of 2
1 of 2
1 of 2
The following analysis follows the methodology outlined in Section 1 to compare PEFA scores across countries and over time. The analysis draws from both the PEFA 2011 and PEFA 2016 frameworks, with each chart explicitly denoting the framework used. Except for the analysis of the repeated PEFA assessments, the latest PEFA assessment in each country is used for comparative purposes. For example, if a country had multiple assessments under the PEFA 2011 framework, only its latest assessment will be used to minimize the potential bias that could occur if some countries had more assessments than others.
Repeat PEFA Assessments
1 of 6
On average, only nine of the 31 performance indicators improved from the 2016 to 2019 period. The three lowest average scoring performance indicators were fiscal risk reporting (PI-10), legislative scrutiny of audit reports (PI-31), and public access to fiscal information (PI-9), while the three highest average scoring performance indicators were internal control on nonsalary expenditure (PI-25), predictability of in-year resource allocation (PI-21), and budget classification (PI-4).
The box plot illustrates that there is significant variation both between and within PEFA scores. The blue bar denotes the statistical distribution from the first quartile of scores (25th percentile) to the third quartile (the 75th percentile), the X denotes the median scores, and the end points denote the highest and lowest country score on each performance indicator. Performance indicators with a longer blue bar have more variation, whereby shorter blue bars denote less variation.
The following section provides an in-depth analysis of the PEFA 2016 Framework and illustrates global and regional differences in performance across the 7 pillars.

Budget Reliability
Budget reliability means that the government budget is realistic and is implemented as intended. This is measured by comparing actual revenues and expenditures—the immediate results of the PFM system—with the original budget approved by the legislature.
The Sustainable Development Goals—target 16.6—recognize that providing a sound basis for development requires that government budgets are comprehensive, transparent, and realistic. This is measured through the PEFA indicator PI—1 aggregate expenditure outturn that assesses the difference between planned and actual budget expenditure in countries across the world.
The recent World Bank SDG Atlas 2020 presents the PEFA data to tell an engaging story, accompanied by interactive charts, on the importance of good budget management during the COVID-19 pandemic.
Paolo de Renzio and Chloe Cho (2020) from International Budget Partnership explore the determinants of budget credibility by using data from 120 PEFA assessments conducted in 94 countries.
A government’s inability to implement the budget as planned could be due to a lack of capacity to forecast revenues and expenditures adequately, an inability to cost the financial impact of government policies properly, or a combination of the two. However, in many cases, governments may be unable to execute budgets as planned due to exogenous factors, such as natural disasters, armed conflicts, or turbulence in international markets. The indicator considers the occurrence of such shocks by only considering the top execution rates in two of the last three years.
“In many cases, governments may be unable to execute budgets as planned due to exogenous factors, such as natural disasters, armed conflicts, health crises such as the current COVID-19 pandemic or other turbulences in international markets.”
The pillar on budget reliability includes three indicators: aggregate expenditure outturn (PI–1), expenditure composition outturn (PI–2), and revenue outturn (PI–3).
Georgia had the highest overall score for budget reliability, followed closely by Ukraine, Uzbekistan, Costa Rica, the Dominican Republic, El Salvador, Guyana, and Morocco. Chad, Gabon, Guinea, Madagascar, Dominica, Paraguay, Suriname, and Afghanistan scored the lowest.
Georgia had the highest overall score for budget reliability, followed closely by Ukraine, Uzbekistan, Costa Rica, the Dominican Republic, El Salvador, Guyana, and Morocco. Chad, Gabon, Guinea, Madagascar, Dominica, Paraguay, Suriname, and Afghanistan scored the lowest.
Countries scored higher on aggregate expenditure outturns (PI–1) than on the other two indicators.
The countries of Europe and Central Asia on average scored the highest on the budget reliability pillar. The countries of Sub-Saharan Africa and South Asia scored the lowest.
On average, the countries of Europe and Central Asia scored the highest on each indicator and very high on the indicator for aggregate expenditure outturn (PI–1). The countries of Sub-Saharan Africa on average scored the lowest on expenditure composition outturn (PI–2), and the countries of South Asia on average scored the lowest on revenue outturn (PI–3).

Transparency of Public Finances
The transparency of public finances pillar assesses whether information on PFM is comprehensive, consistent, and accessible to users. This is achieved through comprehensive budget classification, transparency of all government revenue and expenditure, including intergovernmental transfers, published information on service delivery performance, and ready access to fiscal and budget documentation.
In times of fiscal uncertainty, such as the current COVID-19 pandemic, the timely publication of how resources are created, allocated, and used is even more important to enhance the trust between the government and citizens.
The pillar on transparency of public finances includes six indicators: budget classification (PI–4), budget documentation (PI–5), central government operations outside financial reports (PI–6), transfers to subnational governments (PI–7), performance information for service delivery (PI–8), and public access to fiscal information (PI–9).
Georgia had the highest overall score, followed by Costa Rica, the Philippines, and Ukraine. Grenada and the Lao People’s Democratic Republic scored the lowest.
Georgia had the highest overall score, followed by Costa Rica, the Philippines, and Ukraine. Grenada and the Lao People’s Democratic Republic scored the lowest.
On average, countries scored the highest on budget classification (PI–4), followed closely by budget documentation (PI–5) and transfers to subnational governments (PI–7). They scored the lowest on performance information for service delivery (PI–8) and public access to fiscal information (PI–9).
The countries of Europe and Central Asia scored the highest on average on the transparency of public finances pillar, while the countries of South Asia scored the lowest on average.
The countries of Europe and Central Asia scored the highest on budget classification (PI–4), budget documentation (PI–5), performance information for service delivery (PI–8), and public access to fiscal information (PI–9). For transfers to subnational governments (PI–7), the countries of East Asia and Pacific scored the highest.
On average, all regions scored higher on producing comprehensive budget documentation (PI-5) than making this documentation available for public access (PI-9). The largest divergence was found in the countries of the South Asia region.

Management of Assets and Liabilities
Effective management of assets and liabilities ensures that public investments provide value for money, assets are recorded and managed, fiscal risks are identified, and debts and guarantees are prudently planned, approved, and monitored.
During times of fiscal stress, such as the current COVID-19 pandemic, government typically face increased pressure to disburse funds rapidly, which increases the importance of assessing risk management for investments to ensure value for money.
The pillar on management of assets and liabilities includes four indicators: fiscal risk reporting (PI–10), public investment management (PI–11), public asset management (PI–12), and debt management (PI–13).
Bhutan, Colombia, the Philippines, and Samoa had the highest overall scores, followed closely by Honduras, Rwanda, and Ukraine. Cameroon, São Tomé and Príncipe, Lao PDR, and Iraq had the lowest scores.
Bhutan, Colombia, the Philippines, and Samoa had the highest overall scores, followed closely by Honduras, Rwanda, and Ukraine. Cameroon, São Tomé and Príncipe, Lao PDR, and Iraq had the lowest scores.
Globally, countries scored the highest on average on debt management (PI–13). On average, they scored significantly lower on the other indicators.
On average, the countries of Europe and Central Asia scored the highest on fiscal risk reporting (PI–10) and debt management (PI–13). The countries of East Asia and Pacific scored the highest on public investment management (PI–11) and public asset management (PI–12).
On average, the countries of Europe and Central Asia scored the highest, followed closely by the countries of East Asia and Pacific. The Sub-Saharan Africa region scored the lowest.

Policy-Based Fiscal Strategy and Budgeting
The policy-based fiscal strategy and budgeting pillar assesses whether the fiscal strategy and the budget are prepared with due regard for government fiscal policies, strategic plans, and adequate macroeconomic and fiscal projections.
During periods of economic stress, such as the COVID-19 pandemic, formulating fiscal strategies, plans, and forecasts are challenged by fiscal uncertainties, and may need to be revised on a much shorter time horizon.
The pillar on policy-based fiscal strategy and budgeting includes five indicators: macroeconomic and fiscal forecasting (PI–14), fiscal strategy (PI–15), medium-term perspective in expenditure budgeting (PI–16), budget preparation process (PI–17), and legislative scrutiny of budgets (PI–18).
The Philippines had the highest overall score, followed by Rwanda, Indonesia, and Zambia. São Tomé and Príncipe, Guyana, and West Bank and Gaza had the lowest.
The Philippines had the highest overall score, followed by Rwanda, Indonesia, and Zambia. São Tomé and Príncipe, Guyana, and West Bank and Gaza had the lowest.
Globally, countries on average scored the highest on the budget preparation process (PI–17). They scored the lowest on the medium-term perspective in expenditure budgeting (PI–16).
On average, the countries of Europe and Central Asia scored the highest, followed by the countries of East Asia and Pacific and the countries of South Asia. The Sub-Saharan Africa region scored the lowest.
On average, the countries of Europe and Central Asia scored the highest on macroeconomic and fiscal forecasting (PI–14), medium-term perspective in expenditure budgeting (PI–16), and legislative scrutiny of budgets (PI–18). The countries of South Asia scored the highest on fiscal strategy (PI–15), while the countries of the Middle East and North Africa scored the highest on the budget preparation process (PI–17).

Predictability and Control in Budget Execution
While good budget planning sets the stage for the implementation of budget policies, the budget can only be implemented effectively if it is done within a system of standards, processes, and internal controls. This ensures that resources are obtained and used as intended.
In times of fiscal uncertainties, such as the current COVID-19 pandemic, the ability to monitor public expenditure is even more important than normal due to the risk that extraordinary expenditures will not be used for the intended purposes. Having strong commitment and spending controls helps to ensure that policy responses to crisis situations can be implemented effectively and efficiently.
The pillar on predictability and control in budget execution has eight indicators—the most of any pillar—and covers revenue administration, cash management, expenditure control, procurement, and internal audit. The eight indicators of budget execution are revenue administration (PI–19), accounting for revenue (PI–20), predictability of in-year resource allocation (PI–21), expenditure arrears (PI–22), payroll controls (PI–23), procurement (PI–24), internal controls on nonsalary expenditure (PI–25), and internal audit (PI–26).
Georgia and Kazakhstan scored the highest in Europe and Central Asia and among all countries. In the Middle East and North Africa, Jordan and Morocco scored the highest. In Sub-Saharan Africa, Rwanda and Kenya scored the highest. In Asia, Indonesia and the Philippines scored the highest, and in Latin America and the Caribbean, Paraguay and Dominica scored the highest.
Georgia and Kazakhstan scored the highest in Europe and Central Asia and among all countries. In the Middle East and North Africa, Jordan and Morocco scored the highest. In Sub-Saharan Africa, Rwanda and Kenya scored the highest. In Asia, Indonesia and the Philippines scored the highest, and in Latin America and the Caribbean, Paraguay and Dominica scored the highest.
On average, national governments scored highest on internal controls on nonsalary expenditure (PI–25) and lowest on expenditure areas (PI–22).
On average, countries of Europe and Central Asia scored higher than other regions on predictability and control of budget execution. Countries of Sub-Saharan Africa on average had the lowest scores on budget execution, but some countries in the region, such as Rwanda and Kenya, performed significantly better than the regional average.
On average, countries of Europe and Central Asia scored higher than other regions on all of the indicators of this pillar, with the highest scores on accounting for revenue (PI–20) and predictability of in-year resource allocation (PI–21). The lowest score was for expenditure arrears (PI–22), although it was still higher than that of any other region. The Sub-Saharan Africa region had the lowest average indicator scores among all regions, with countries scoring highest on PI–20 and lowest on PI–22.
Countries’ stock of expenditure arrears (PI–22.1) was around 10 percent of total expenditure in two of the last completed fiscal years; in line with good international practice, it should not be more than 2 percent. At the same time, however, countries on average scored much higher on expenditure management control (PI–25.2), suggesting that on average effective expenditure commitment controls are in place.

Accounting and Reporting
Robust accounting and reporting systems are needed for effective public financial management. This is typically achieved through maintaining accurate and reliable records, producing and disseminating information on public finance performance at appropriate times for decision making and reporting requirements, and providing accurate information to citizens.
In times of fiscal uncertainties, robust accounting and reporting systems are even more important to ensure that there is full accountability over resources allocated to finance policy responses related to crisis management.
“Robust accounting and reporting systems are a foundation of trust and accountability.”
The PEFA framework measures the effectiveness of accounting and reporting systems through three key indicators: financial data integrity (PI–27), in-year budget reports (PI–28), and annual financial reports (PI–29).
The Seychelles and Uganda scored the highest in Sub-Saharan Africa, and the Seychelles had the overall highest global score. In Asia, Indonesia had the highest score, while in Europe and Central Asia, Kazakhstan and Ukraine scored the highest. The Dominican Republic had the highest score in Latin America and the Caribbean.
The Seychelles and Uganda scored the highest in Sub-Saharan Africa, and the Seychelles had the overall highest global score. In Asia, Indonesia had the highest score, while in Europe and Central Asia, Kazakhstan and Ukraine scored the highest. The Dominican Republic had the highest score in Latin America and the Caribbean.
Countries on average scored highest on financial data integrity (PI–27), but only scored an average “C” grade on in-year budget reports (PI–28) and annual financial reports (PI–29), even though these two indicators are recognized as being critical for accountability and transparency in the PFM system.
On average, countries in Europe and Central Asia performed better than countries in other regions on the accounting and reporting pillar, followed by countries in East Asia and Pacific and in Southeast Asia.
On average, countries of Europe and Central Asia scored higher than other regions on financial data integrity (PI–27) and in-year budget reports (PI–28) but scored the lowest on annual financial reports (PI–29). Countries of Latin America and the Caribbean scored the highest on annual financial reports and the lowest on financial data integrity.
The chart presents the regional comparison of the following:
The timing of the preparation of annual financial reports and their submission for external audit (PI–29.2); in line with good international practice, annual financial reports should be submitted for external audit within three months of the end of the fiscal year
The timing of external audit of annual financial reports and their submission by supreme audit institutions for external scrutiny by the legislature (PI–30.2); in line with good internal practice, audit financial reports should be submitted within three months of receipt of reports
The timing of scrutiny of audit reports by the legislature (PI–31.1); in line with good international practice, scrutiny of audit reports should be completed by the legislature within three months of receipt of the reports.
Globally, countries on average submit financial reports for external audit within nine months of the end of the fiscal year. On average, globally, the supreme audit institutions complete the audit of annual financial reports and submit them for review to the legislature within nine months of the receipt of reports. However, the countries of Europe and Central Asia perform well above the global average. On average, globally, legislatures complete the scrutiny of audit reports on the implementation of budgets within 12 months. Only countries of Europe and Central Asia perform better.

External Audit and Scrutiny
Effective external audit and scrutiny by the legislature are important to hold the government’s executive branch to account for the implementation of its fiscal and expenditure policies. This pillar assesses whether public finances are independently reviewed by a supreme audit institution and the role of legislature in reviewing the audit reports and holding the executive accountable.
This pillar has two indicators: external audit (PI–30) and legislative scrutiny of audit reports (PI–31).
Effective external audit and scrutiny are even more important in times of fiscal uncertainties, such as the current COVID-19 pandemic, because they ensure that fiscal policy responses to crises are externally reviewed and scrutinized and require government to respond to and effectively implement any recommendations for improvement. They also enable citizens to learn about and potentially to influence policy.
Bhutan and Montenegro had the highest global score. Honduras was the only country to receive the highest “A” score for legislative scrutiny.
Bhutan and Montenegro had the highest global score. Honduras was the only country to receive the highest “A” score for legislative scrutiny.
On average, countries scored relatively low on external security and audit.
The countries of Europe and Central Asia and South Asia on average scored significantly higher than their regional peers.
The countries of Europe and Central Asia on average scored the highest on external audit, while the countries of South Asia scored the highest on legislative scrutiny of audit reports. Conversely, the countries of Latin America and the Caribbean on average scored the lowest on these two indicators.
Globally, legislatures on average performed better on scrutinizing budgets (PI–18) than on scrutinizing audit reports or the implementation of budgets (PI–31). Only countries of South Asia performed better on legislative scrutiny of audit reports than on scrutiny of budget plans.